Volume in technical analysis
Introduction
Definition of volume in technical analysis
Simply put, volume refers to the number of shares or contracts traded in a given period of time. In other words, it is a measure of how much activity is taking place in the market.
The role of volume in technical analysis
Technical analysis is a method of evaluating securities by analyzing statistics generated by market activity, such as past prices and volume. In this context, volume can serve as a powerful indicator of market sentiment and provide valuable insight into the strength of a trend. By studying volume in relation to price movements, traders and investors can gain a deeper understanding of the market and make more informed decisions.
In this blog post, we will explore how volume is used in technical analysis and discuss the benefits and limitations of using volume as a tool. We’ll also provide tips on how to incorporate volume into your technical analysis practice for a more comprehensive approach to market analysis. So let’s get started!
The importance of volume in technical analysis

(1) Confirming price trends
- In technical analysis, volume is often used to confirm the strength of a price trend.
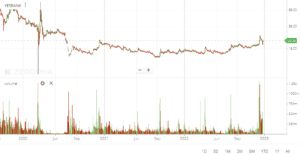
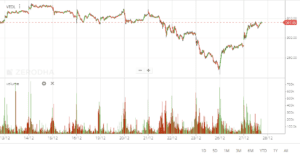
- When a stock is experiencing a strong uptrend, for example, we would expect to see high volume on up days and low volume on down days. This is because a strong uptrend is being supported by heavy buying activity, which is reflected in the volume data.
- On the other hand, if we see low volume during an uptrend, it could be a sign that the trend is losing momentum and may be at risk of reversing.
- Similarly, high volume during a downtrend can indicate a strong bearish trend, while low volume could suggest that the trend is losing steam.
(2) Identifying potential reversals
- In addition to confirming trends, volume can also be used to identify potential reversals in the market.
- When we see a sudden increase in volume during a price trend, it can be a signal that the trend may be coming to an end and that a reversal is imminent.
- For example, if we see a stock that has been in an uptrend and suddenly experiences a sharp increase in volume, it could be a sign that the trend is about to reverse and head downward.
- Similarly, if we see a stock that has been in a downtrend and experiences a sudden surge in volume, it could be a sign that the trend is about to reverse and head upward.
(3) Identifying breakouts
- Volume can also be used to identify breakouts from key price levels or chart patterns.
- When a stock is trading within a range or a specific chart pattern (such as a triangle or a wedge), we would expect to see relatively low volume as the stock bounces back and forth within the range or pattern.
- If the stock suddenly experiences a surge in volume as it breaks out of the range or pattern, it could be a sign that the breakout is genuine and that the stock is likely to continue moving in the direction of the breakout.
- High volume at key price levels (such as a resistance level or support level) can also be a sign of a breakout, as increased buying or selling activity can push the stock through the key level.
Limitations of volume in technical analysis

- Not all markets have reliable volume data: Some markets, such as the forex market, do not have reliable volume data because there is no centralized exchange. This makes it difficult to use volume as a technical analysis tool in these markets.
- Volume can be misleading: Volume can be artificially inflated or manipulated, which can make it difficult to interpret. For example, a large volume spike may not necessarily indicate a change in trend if it is due to manipulation or other artificial factors.
- Volume can be influenced by external factors: External factors, such as news events or economic data releases, can influence volume and make it difficult to interpret.
- Volume should be used in conjunction with other technical analysis tools: While volume can be a useful indicator, it should not be used in isolation. It is important to consider volume in combination with other technical analysis tools, such as price action and chart patterns, to get a more comprehensive view of market trends.
- Volume may not always lead price: While volume can often confirm price movements, there are times when volume may not lead price. For example, a stock may see increased volume but not necessarily move in the direction that volume would suggest. In these cases, it is important to consider other technical and fundamental factors before making a trading decision.
Tips for incorporating volume in technical analysis

- Consider volume in relation to price: One way to use volume is to look at the volume-price relationship. For example, if a stock is making new highs on high volume, it can be a sign of a strong trend. On the other hand, if a stock is making new highs on low volume, it may be a sign of a weak trend.
- Look for volume confirmation: It can be helpful to wait for volume to confirm price movements before entering a trade. For example, if a stock is breaking out of a range on high volume, it may be a more reliable breakout than if the stock is breaking out on low volume.
- Use volume in combination with other indicators: Volume should be used in conjunction with other technical analysis tools, such as trendlines, chart patterns, and moving averages. This can help provide a more comprehensive view of market conditions.
- Pay attention to volume spikes: Large spikes in volume can sometimes signal a potential change in trend. For example, a sudden increase in volume on a downtrend may indicate that the downtrend is losing momentum and a reversal may be imminent.
- Consider the broader market context: It can be helpful to consider volume in relation to the broader market context. For example, if the overall market is seeing high volume, it may be a sign of increased market activity, while low volume may indicate a lack of interest in the market.
Conclusion
Volume is an important factor to consider in technical analysis as it can provide insight into the strength of a trend and the likelihood of a potential reversal. By considering volume in relation to price, looking for volume confirmation, and using volume in combination with other indicators, traders can gain a more comprehensive view of market conditions and make more informed trading decisions.
However, it is important to keep in mind the limitations of using volume, such as the potential for data to be misleading or manipulated, and to use volume in conjunction with other technical analysis tools to get a more well-rounded understanding of the market. Overall, incorporating volume into technical analysis can be a valuable tool for traders looking to make informed decisions in the market.

Volume in technical analysis
Also read : Trend lines to identify support and resistance
Also read : Fibonacci retracement and Stochastic oscillator


