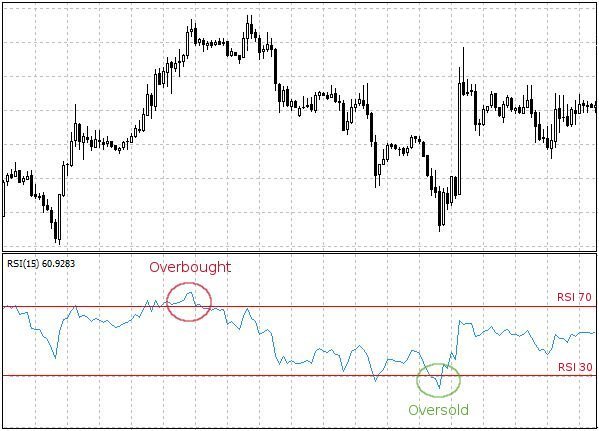
Using trend lines to identify support and resistance levels
Trend lines are an important tool in technical analysis that can be used to identify key support and resistance levels in a stock’s price chart. These levels can be useful for traders looking to enter or exit a position, as well as for investors trying to gauge the overall trend of a stock. In this article, we’ll discuss what trend lines are, how to draw them, and how to use them to identify key support and resistance levels.
What are trend lines?
Trend lines are diagonal lines drawn on a stock’s price chart that connect two or more price points. These lines can help identify the direction and strength of a trend, as well as potential areas of support and resistance. There are two types of trend lines: uptrend lines and downtrend lines.
Uptrend line
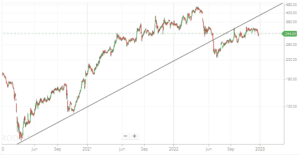
An uptrend line is drawn by connecting two or more price lows on a chart. This line represents the bottom of a bullish trend, and it indicates that the stock is likely to continue moving higher as long as it stays above the trend line.
Downtrend line
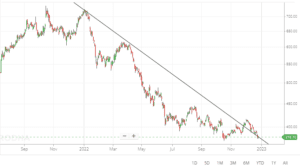
A downtrend line is drawn by connecting two or more price highs on a chart. This line represents the top of a bearish trend, and it indicates that the stock is likely to continue moving lower as long as it stays below the trend line.
How to draw trend lines
To draw a trend line, you’ll need to identify two or more points on the chart that represent the trend you’re trying to identify. For example, if you’re trying to identify an uptrend, you’ll need to find two or more price lows on the chart. Once you’ve identified these points, you can connect them with a diagonal line.
It’s important to make sure that you’re connecting the correct points when drawing a trend line. If you connect the wrong points, the trend line may not accurately represent the trend of the stock. It’s also important to use a straight edge when drawing the trend line to ensure that it is a straight and diagonal line.
How to use trend lines to identify support and resistance levels ?
Once you’ve drawn a trend line on a stock’s price chart, you can use it to identify key support and resistance levels.
Support levels
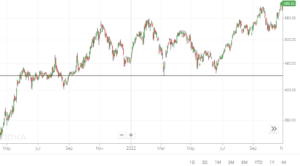
Support levels are areas where the price of a stock is likely to find buying interest, which can cause the price to bounce off the support level and move higher. Support levels are typically found at or near the trend line of an uptrend, as buyers are more likely to enter the market at these levels.
Resistance levels
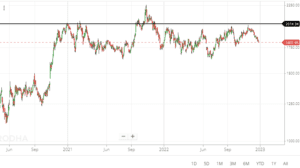
Resistance levels are areas where the price of a stock is likely to find selling pressure, which can cause the price to bounce off the resistance level and move lower. Resistance levels are typically found at or near the trend line of a downtrend, as sellers are more likely to enter the market at these levels.
Trend lines can be a useful tool for identifying key support and resistance levels, but it’s important to keep in mind that these levels are not always fixed. The price of a stock can break through a trend line and continue moving in the opposite direction, indicating that the trend has changed. It’s also important to use other technical analysis tools, such as moving averages and oscillators, to confirm the trend and identify potential trading opportunities.
Conclusion
Trend lines are an important tool in technical analysis that can be used to identify key support and resistance levels in a stock’s price chart. By connecting two or more points on the chart, trend lines can help identify the direction and strength of a trend and provide traders and investors with potential entry and exit points. However, it’s important to keep in mind that trend lines are not always fixed, and the price of a stock can break through them, indicating a change in the trend. To get the most out of using trend lines, it’s important to use them in conjunction with other technical analysis tools and to remain flexible and open to changing market conditions.
It’s also worth noting that trend lines are more reliable on longer time frames, such as daily or weekly charts, rather than shorter time frames like intraday charts. This is because trend lines on longer time frames tend to be more established and have a greater likelihood of holding up as support or resistance levels.
Summary : Trend lines are a valuable tool for identifying key support and resistance levels in a stock’s price chart. By understanding how to draw and interpret trend lines, traders and investors can make more informed trading decisions and potentially capitalize on price movements in the market.
Using trend lines to identify support and resistance levels
Also read : Technical analysis of shares
Also read : RSI, Bollinger bands and MACD


