


Technical Analysis of shares
Technical analysis is a method of evaluating securities by analyzing statistics generated by market activity, such as past prices and volume. This technique attempts to forecast the direction of prices through the study of past market data, primarily price and volume.
To perform a technical analysis of shares, an analyst would first gather data on the company’s past stock price and trading volume. This data can be obtained from various sources, including financial websites, brokerage firms, and public databases.
The analyst would then use various tools and techniques to analyze the data and identify trends and patterns. Some common tools used in technical analysis include trend lines, moving averages, and oscillators.

Trend lines for technical analysis of shares are lines drawn on a chart to connect a series of prices and show the overall direction of the stock. They can be used to identify trends, such as uptrends, downtrends, and sideways movement.
Moving averages for technical analysis of shares are used to smooth out short-term price fluctuations and show the stock’s overall direction. They are calculated by taking the average of a certain number of past prices.
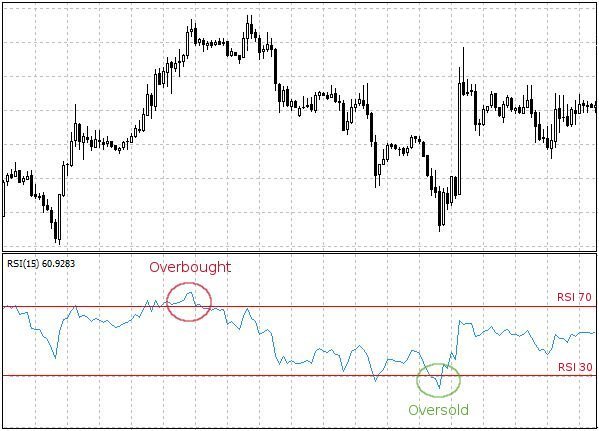
Oscillators for technical analysis of shares are indicators that show when a stock is overbought or oversold. They are often used to identify potential entry and exit points for trades.
Once the analyst has identified trends and patterns, they can use this information to make predictions about the future direction of the stock. They may also use other factors, such as the company’s financial health, news and events, and market conditions, to make their predictions.
Conclusion :- Technical analysis is a valuable tool for investors looking to make informed decisions about buying and selling shares. It can provide valuable insights into the direction of prices and help investors identify potential opportunities and risks in the market.
Various Indicators for technical analysis of shares

- Moving average (MA): This is a technical indicator that shows the average value of a stock’s price over a certain period of time, typically the past 50 or 200 days. It is used to smooth out price fluctuations and identify trend direction.
- Relative strength index (RSI): This is a momentum indicator that measures the magnitude of a stock’s price movements over a certain period of time, typically 14 days. It is used to identify overbought and oversold conditions, as well as potential trend reversals.
- Bollinger bands: This is a technical indicator that consists of a moving average and two bands above and below it, representing the standard deviation of the stock’s price. It is used to identify potential breakouts and trend changes.
- Moving average convergence/divergence (MACD): This is a trend-following momentum indicator that shows the relationship between two moving averages of a stock’s price. It is used to identify potential trend changes and signal entry and exit points in the market.
- Stochastic oscillator: This is a momentum indicator that measures the level of a stock’s price relative to its range over a certain period of time. It is used to identify overbought and oversold conditions, as well as potential trend reversals.
- Fibonacci retracement: This is a technical indicator that uses horizontal lines to indicate areas of support and resistance based on the Fibonacci sequence. It is used to identify potential entry and exit points in the market.
- Candlestick chart: This is a type of financial chart that shows the open, high, low, and close prices for a stock over a certain period of time. It is used to identify potential trend changes and signal entry and exit points in the market.
- Ichimoku indicator : The Ichimoku indicator is a technical analysis tool that uses multiple moving averages to identify key support and resistance levels, as well as potential trend direction and momentum. It consists of five components: the Tenkan-Sen, the Kijun-Sen, the Senkou Span A, the Senkou Span B, and the Chikou Span. These lines are used in combination to provide a comprehensive view of market conditions.

Technical Analysis of shares
You may also be interested in Fundamental Analysis of shares