RSI trading strategy books
- “New Concepts in Technical Trading Systems” by J. Welles Wilder Jr. – This book was published in 1978 and is considered a classic in the field of technical analysis. It introduces the RSI and explains how to use it to identify overbought and oversold conditions in the market.
- “Technical Analysis Using Multiple Timeframes” by Brian Shannon – This book explains how to use multiple timeframes to improve the accuracy of RSI signals and make better trading decisions. It also covers other technical indicators and provides a detailed trading plan for using them in combination with RSI.
- “The RSI PRO Scalping Strategy” by John F. Carter – This book provides a detailed strategy for using RSI to scalp the markets. It includes specific entry and exit rules, as well as money management guidelines and risk management techniques.
- “Trading with RSI” by John Hayden – This book provides a comprehensive overview of RSI and how to use it in different market conditions. It includes a variety of trading strategies, as well as tips for managing risk and optimizing trade performance.
Which should we see PE or RSI for buying stocks?


The PE ratio is a financial ratio that compares a company’s current stock price to its earnings per share (EPS). It can be used to gauge whether a stock is overvalued or undervalued relative to its earnings. A high PE ratio may indicate that a stock is overvalued, while a low PE ratio may suggest that it is undervalued.
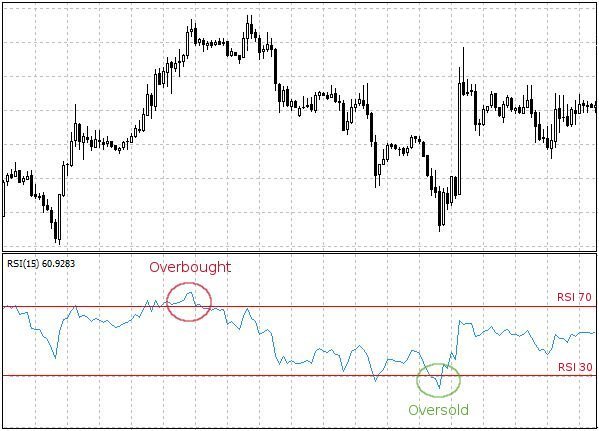
On the other hand, the RSI is a momentum indicator that measures the strength of a stock’s price movement. It is typically used to identify overbought or oversold conditions in a stock. A high RSI value may indicate that a stock is overbought, while a low RSI value may suggest that it is oversold.
Both the PE ratio and RSI can be useful tools for evaluating stocks and making investment decisions, but they should be used in conjunction with other analysis techniques, such as fundamental analysis, to get a more comprehensive view of a stock’s potential. It is also important to note that technical indicators like these are not perfect and should not be used in isolation to make investment decisions.
How to know price movement required for a unit change in RSI?

The price movement required for a unit change in the Relative Strength Index (RSI) depends on the formula used to calculate the indicator.
The most common formula for calculating RSI is:
RSI = 100 – (100 / (1 + RS))
where RS is the relative strength and is calculated as the average gain over a given number of periods divided by the average loss over the same number of periods.
The number of periods used to calculate RS and RSI is a user-defined parameter and can range from as low as 1 to as high as 200. A longer number of periods will result in a smoother RSI, while a shorter number of periods will result in a more sensitive RSI.
To determine the price movement required for a unit change in RSI, you can use the following steps:
- Determine the number of periods you are using to calculate RSI.
- Calculate the average gain and average loss over the number of periods you are using.
- Divide the average gain by the average loss to get the relative strength (RS).
- Substitute the value of RS into the RSI formula to calculate the current RSI value.
- Calculate the price movement required to change the average gain or average loss by a unit amount (e.g., $1).
- Substitute the new average gain or average loss into the RSI formula to calculate the new RSI value.
- Subtract the new RSI value from the current RSI value to determine the unit change in RSI.
- Divide the unit change in RSI by the price movement required to produce the unit change in average gain or average loss to determine the price movement required for a unit change in RSI.
It’s important to note that this calculation is based on the assumption that the average gain and average loss remain constant. In reality, the average gain and average loss will change as the price of the security moves up or down, so the price movement required for a unit change in RSI will also change.
RSI trading strategy books
Also read : RSI, Bollinger band and RSI indicators
Also read : Benefits and drawbacks of RSI


