


Three popular indicators that are used in technical analysis are explained in detail as under :
Relative strength Index (RSI)
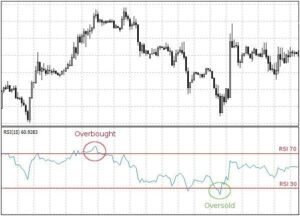
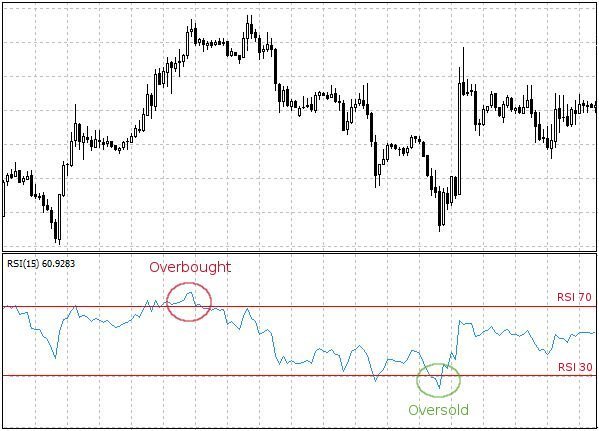
The relative strength index (RSI) is a technical analysis indicator that measures the strength of a stock’s price action by comparing the magnitude of its recent gains to its recent losses. It is calculated using the following formula:
RSI = 100 – (100 / (1 + (Average Gain / Average Loss)))
The RSI ranges from 0 to 100, with a reading above 70 indicating that a stock may be overbought and a reading below 30 indicating that it may be oversold.
For example, let’s say that a stock has gained ₹ 10 in the last four days and lost ₹ 5 in the last four days. Its average gain would be ₹ 2.50 and its average loss would be ₹ 1.25. Using the formula above, we can calculate its RSI as follows:
RSI = 100 – (100 / (1 + (2.50 / 1.25)))
RSI = 100 – (100 / (1 + 2))
RSI = 100 – (100 / 3)
RSI = 100 – 33.33
RSI = 66.67
In this example, the stock’s RSI is 66.67, indicating that it is relatively strong and may not be overbought or oversold.
Another example would be a stock that has gained ₹ 15 in the last four days and lost ₹ 20 in the last four days. Its average gain would be ₹ 3.75 and its average loss would be ₹ 5. Using the formula above, we can calculate its RSI as follows:
RSI = 100 – (100 / (1 + (3.75 / 5)))
RSI = 100 – (100 / (1 + 0.75))
RSI = 100 – (100 / 1.75)
RSI = 100 – 57.14
RSI = 42.86
In this example, the stock’s RSI is 42.86, indicating that it may be oversold and may be a good time to buy.
Conclusion : the RSI is a useful tool for identifying potential buying and selling opportunities based on the strength of a stock’s price action. However, it is important to remember that it should not be used in isolation and should be used in conjunction with other technical analysis indicators and fundamental analysis to make informed investment decisions.
Bollinger bands
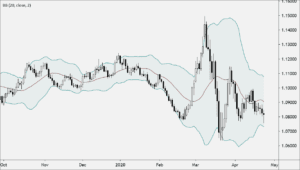
Bollinger bands are a technical analysis tool that consists of three lines drawn on a stock chart. The middle line is a simple moving average (SMA) of the stock’s price, and the upper and lower bands are plotted a certain number of standard deviations above and below the SMA.
For example, if the SMA of a stock’s price is ₹ 100 and the upper and lower bands are plotted two standard deviations above and below the SMA, the upper band would be at ₹ 116 [₹ 100 + 2*(standard deviation of stock price)], and the lower band would be at ₹ 84 [₹ 100 – 2*(standard deviation of stock price)].
Bollinger bands are useful for identifying periods of high and low volatility in a stock’s price. When the stock’s price is within the upper and lower bands, it is considered to be in a trading range, and when it breaks out of the bands, it is considered to be trending.
For example, if a stock’s price is within the upper and lower bands for an extended period of time, it may be a good time to sell the stock, as the stock’s price is not likely to make significant movements in the near future. On the other hand, if the stock’s price breaks out of the upper band, it may be a good time to buy the stock, as it is likely to continue to rise.
Bollinger bands can also be used to identify potential overbought or oversold levels for a stock. When the stock’s price is near the upper band, it may be overbought, and when it is near the lower band, it may be oversold.
Conclusion : Bollinger bands provide a useful tool for traders and investors to identify potential trading opportunities in a stock’s price movements.
Moving Average Convergence Divergence (MACD)
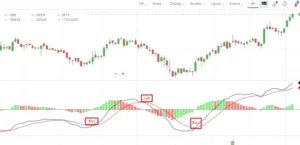
The MACD (Moving Average Convergence Divergence) is a technical indicator used to identify trend changes in stock prices. It is calculated by taking the difference between a short-term moving average (12-day) and a long-term moving average (26-day) of the stock price.
For example, if the stock price of Company X is ₹ 50 on Day 1, ₹ 52 on Day 2, and ₹ 54 on Day 3, the 12-day moving average on Day 3 would be calculated as follows: (50 + 52 + 54) / 3 = ₹ 52.
If the stock price on Day 4 is ₹ 56, the 12-day moving average on Day 4 would be calculated as follows: (52 + 54 + 56) / 3 = ₹ 54.
The 26-day moving average on Day 4 would be calculated using the same method, but using the stock prices from the past 26 days instead of just the past 3 days.
The MACD is then calculated by subtracting the 26-day moving average from the 12-day moving average, which in this example would be ₹54 – ₹52 = ₹2.
If the MACD is positive, it indicates that the stock price is trending upwards. If the MACD is negative, it indicates that the stock price is trending downwards.
Traders often use the MACD in conjunction with other indicators, such as the relative strength index (RSI) or the stochastic oscillator, to confirm a potential trend change.
For example, if the MACD is positive and the RSI is above 70, it may indicate that the stock is overbought and may be due for a correction. On the other hand, if the MACD is negative and the RSI is below 30, it may indicate that the stock is oversold and may be a good buying opportunity.
Conclusion : the MACD is a useful tool for traders to identify potential trend changes in stock prices and make informed trading decisions.
5 Strategies using Relative Strength Index (RSI) & Bollinger bands together
- Use the RSI to identify overbought and oversold conditions, and confirm with the Bollinger Bands to assess the strength of the trend.
- Look for RSI divergences with the Bollinger Bands, as this can indicate a potential reversal in the trend.
- Use the RSI to identify potential entry and exit points based on the Bollinger Bands, such as buying when the RSI is oversold and the price is at the lower Bollinger Band, or selling when the RSI is overbought and the price is at the upper Bollinger Band.
- Combine the RSI with Bollinger Band width to identify periods of high and low volatility. Use the RSI to confirm the strength of the trend during these periods.
- Use the RSI to confirm Bollinger Band breakouts, as this can indicate a potential change in trend direction.
5 Strategies using MACD & Bollinger bands together
- Identify divergences between the MACD and price action, as well as between the Bollinger Bands and price action, to predict potential trend reversals.
- Use the MACD to identify momentum and trend direction, and the Bollinger Bands to identify areas of support and resistance.
- Look for Bollinger Band squeezes, where the bands are narrowing, as a potential sign of a breakout in either direction. Use the MACD to confirm the breakout direction.
- Use the Bollinger Bands to identify overbought or oversold conditions, and the MACD to confirm the strength of the trend.
- Use the MACD to identify potential trend changes, and the Bollinger Bands to provide confirmation by showing a breakout or reversal in the bands.
5 Strategies using MACD & Relative Strength Index (RSI) together
- Identify potential entry points by looking for divergences between the MACD and RSI. For example, if the MACD is indicating a bullish trend while the RSI is showing bearish momentum, this may be a good time to enter a long position.
- Use the MACD to confirm the strength of a trend, and the RSI to identify overbought or oversold levels. For example, if the MACD is indicating a strong uptrend but the RSI is showing the asset is overbought, it may be a good time to take profits or exit a long position.
- Use the MACD and RSI together to identify potential trend reversals. For example, if the MACD is indicating a bullish trend but the RSI is showing bearish divergence, this may be a sign that the trend is about to reverse.
- Use the MACD to identify the direction of the trend, and the RSI to identify potential areas of support and resistance. For example, if the MACD is indicating a bullish trend, look for areas where the RSI has previously found support or resistance to identify potential entry or exit points.
- Combine the MACD and RSI with other technical indicators, such as moving averages or Bollinger Bands, to create a more comprehensive trading strategy. For example, you could use the MACD to identify the direction of the trend, the RSI to identify overbought or oversold levels, and moving averages to confirm the trend and identify potential areas of support and resistance.
You may also be interested in Technical Analysis of shares.