


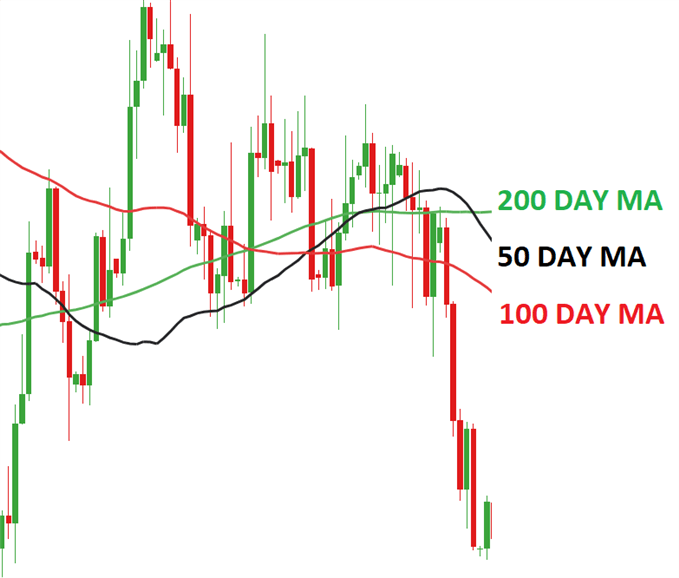
Moving Averages in technical analysis
Moving averages are a statistical measure that averages out a set of data over a certain time period. This technique is commonly used in finance, investing, and trading to identify trends and make predictions about future price movements.
For example, if you want to calculate a moving average(MA) for a stock’s closing price over the past 10 days, you would add up the ‘closing prices’ for the past 10 days and divide by 10. This would give you an average closing price for the stock over the past 10 days.
If you wanted to calculate a moving average(MA) for the stock’s closing price over the past 20 days, you would add up the ‘closing prices’ for the past 20 days and divide by 20. This would give you an average closing price for the stock over the past 20 days.
The moving average helps to smooth out fluctuations in the data and provide a clearer picture of the overall trend. For example, if a stock’s closing price has been fluctuating wildly over the past few days, the moving average can help to smooth out these fluctuations and provide a more accurate representation of the stock’s overall trend.
One of the main benefits of using moving averages is that they are easy to calculate and interpret. They are also widely used in the financial industry, which means that they are a reliable and widely accepted measure of trend.
There are several different types of moving averages, including simple moving averages, exponential moving averages, and weighted moving averages. Each of these moving averages uses a slightly different method to calculate the average, which can affect the accuracy of the trend analysis.

Simple moving average
A simple moving average is calculated by adding up the closing prices for a given number of days and dividing by the number of days. This method provides a straightforward and easy-to-understand representation of the stock’s trend.
Here is an example of how to calculate a 10-day moving average:
Suppose you have the following data:
Day 1: 5 Day 2: 6 Day 3: 7 Day 4: 8 Day 5: 9 Day 6: 10 Day 7: 11 Day 8: 12 Day 9: 13 Day 10: 14
To calculate the 10-day moving average, you would add up the prices for the past 10 days and then divide by 10, like this:
(5 + 6 + 7 + 8 + 9 + 10 + 11 + 12 + 13 + 14) / 10 = 10
This means that the 10-day moving average for Day 10 is 10.
You can then use this moving average as a point on the chart and repeat the calculation for each subsequent day, using the most recent 10 days of data to calculate the moving average.
Here is an example of how to use a 10-day moving average to smooth out short-term fluctuations in data:
Suppose you have the following data:
Day 1: 5
Day 2: 6
Day 3: 7
Day 4: 8
Day 5: 9
Day 6: 10
Day 7: 11
Day 8: 12
Day 9: 13
Day 10: 14
Day 11: 15
Day 12: 16
Day 13: 17
Day 14: 18
Day 15: 19
Day 16: 20
You can use a 10-day moving average to smooth out the data and make it easier to identify trends. Here is how the moving averages would be calculated for each day:
Day 10: (5 + 6 + 7 + 8 + 9 + 10 + 11 + 12 + 13 + 14) / 10 = 10
Day 11: (6 + 7 + 8 + 9 + 10 + 11 + 12 + 13 + 14 + 15) / 10 = 11
Day 12: (7 + 8 + 9 + 10 + 11 + 12 + 13 + 14 + 15 + 16) / 10 = 12
Day 13: (8 + 9 + 10 + 11 + 12 + 13 + 14 + 15 + 16 + 17) / 10 = 13
Day 14: (9 + 10 + 11 + 12 + 13 + 14 + 15 + 16 + 17 + 18) / 10 = 14
Day 15: (10 + 11 + 12 + 13 + 14 + 15 + 16 + 17 + 18 + 19) / 10 = 15 and so on.

Exponential moving average
An exponential moving average, on the other hand, gives more weight to recent data points and less weight to older data points. This method is often considered to be more accurate than a simple moving average because it takes into account the most recent data points, which can provide a more accurate representation of the stock’s trend.
For example, let’s say we have the following stock prices:
| Date | Price |
|---|---|
| 1/1/2021 | 100 |
| 1/2/2021 | 105 |
| 1/3/2021 | 110 |
| 1/4/2021 | 115 |
| 1/5/2021 | 120 |
| 1/6/2021 | 125 |
To calculate the EMA for the first day, we would take the closing price of 100 and apply a percentage (usually between 0.8 and 0.99) to it. Let’s say we use 0.9. This means that 90% of the first day’s EMA will be the closing price of 100, and 10% will be the previous period’s EMA (which in this case is 0 since it’s the first day). So the EMA for 1/1/2021 would be 100 x 0.9 + 0 x 0.1 = 90.
To calculate the EMA for the second day, we would take the closing price of 105 and apply the same percentage (0.9 in this case) to it. We would also add the previous period’s EMA (90 in this case) to the calculation. So the EMA for 1/2/2021 would be 105 x 0.9 + 90 x 0.1 = 94.5.
This process continues for each day, with the EMA for the current period being a weighted average of the closing price and the previous period’s EMA. So the EMA for 1/3/2021 would be 110 x 0.9 + 94.5 x 0.1 = 99.95, and the EMA for 1/4/2021 would be 115 x 0.9 + 99.95 x 0.1 = 105.495, and so on.
Weighted moving average
A weighted moving average, meanwhile, assigns different weights to different data points in the calculation. For example, a weighted moving average might assign a higher weight to recent data points and a lower weight to older data points. This method is often considered to be more accurate than a simple moving average because it takes into account the relative importance of different data points in the calculation.
For example, let’s say we have a dataset of daily stock prices for a company over a period of 10 days. The weighted moving average for the first five days would be calculated as follows:
Day 1: ₹10 (weight = 0.1)
Day 2: ₹11 (weight = 0.2)
Day 3: ₹12 (weight = 0.3)
Day 4: ₹13 (weight = 0.4)
Day 5: ₹14 (weight = 0.5)
The weighted moving average for these five days would be:
(₹10 x 0.1) + (₹11 x 0.2) + (₹12 x 0.3) + (₹13 x 0.4) + (₹14 x 0.5) = ₹1 + ₹2.2 + ₹3.6 + ₹5.2 + ₹7 = ₹19
This weighted moving average takes into account the recent data points and gives them more weight, resulting in a smoother and more accurate representation of the trend in the stock price.
The weights used in a weighted moving average can be customized based on the needs of the analysis. For example, if we want to give even more weight to the most recent data points, we could use weights of 0.2, 0.3, 0.4, 0.5, and 0.6 for the first five days. This would result in a weighted moving average of ₹20.6.

Conclusion :- Moving averages are a useful tool for analyzing trends and making predictions about future price movements. They are widely used in finance, investing, and trading, and are a valuable tool for anyone looking to make more informed decisions about their investments.
Moving Averages in technical analysis
You may also be interested in basic knowledge about various indicators for technical analysis of shares.