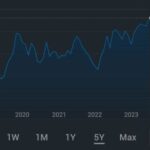
Introduction to swing trading
Welcome to our guide on mastering the art of swing trading! In this guide, we will provide a step-by-step overview of how to use technical analysis to identify and execute swing trades.
But before we dive into the details, let’s start by defining swing trading and discussing the benefits of this popular trading strategy.
Swing trading meaning
Swing trading refers to a style of trading in which traders hold positions for a period of a few days to a few weeks, with the goal of capturing short-term price movements. This can be a more intermediate-term approach compared to day trading, which involves holding positions for a shorter period of time, or long-term investing, which involves holding positions for a longer period of time.
Benefits of Swing trading
- One advantage is that it allows traders to take advantage of short-term price movements without committing to a long-term investment.
- This can be particularly useful in fast-moving markets, where prices can change quickly and significantly.
- Additionally, swing trading can be less time-intensive compared to day trading, as traders don’t need to constantly monitor their positions and can hold onto their positions for a longer period of time.
Importance of technical analysis in swing trading
- Technical analysis is a key tool for successful swing trading.
- Technical analysis involves using past price and volume data to identify patterns and trends that can provide insight into future price movements.
- By using technical analysis, swing traders can better predict when to enter and exit trades, and can also identify key levels of support and resistance.

Setting up your swing trading strategy
(1) Identifying your trading objectives and risk tolerance
- It is important to have a clear understanding of your trading objectives and risk tolerance before setting up your swing trading strategy.
- Your trading objectives might include things like maximizing returns, minimizing risk, or achieving a balance between the two.
- Your risk tolerance, on the other hand, refers to the amount of risk you are willing to take on in pursuit of your trading objectives.
- Understanding your risk tolerance will help you determine the appropriate level of risk to take on in each trade, which is crucial for managing your trades effectively.
(2) Choosing the right assets to trade
- Selecting the right assets to trade is a key part of setting up your swing trading strategy.
- Different assets have different characteristics, and it is important to choose assets that align with your trading objectives and risk tolerance.
- For example, if you have a high risk tolerance and are looking for high returns, you might consider trading more volatile assets such as small-cap stocks.
- On the other hand, if you have a lower risk tolerance, you might choose to trade more stable assets such as large-cap stocks or blue-chip bonds.
(3) Setting stop-loss and take-profit orders
- Stop-loss and take-profit orders are important tools for managing your trades and protecting against potential losses.
- A stop-loss order is an order to sell a security if it “falls below” a certain price, while a take-profit order is an order to sell a security if it “reaches” a certain price.
- By setting these orders, you can limit your potential losses and lock in profits when your trade goes in your favor.
- It is important to carefully consider the levels at which you set your stop-loss and take-profit orders, as they will play a key role in your overall risk management strategy.
Understanding technical indicators
(1) Types of technical indicators
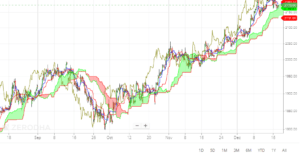
Technical indicators are mathematical calculations based on the price and/or volume of an asset, and they are used to help traders identify trends, patterns, and potential trading opportunities. There are many different types of technical indicators, and they can be broadly classified into three categories: trend indicators, oscillators, and volume indicators.
- Trend indicators are designed to help traders identify the direction of a trend and the strength of a trend. Some examples of trend indicators include moving averages, trend lines, and the average directional index (ADX).
- Oscillators are technical indicators that fluctuate between fixed values, and they are used to identify overbought and oversold conditions in the market. Some examples of oscillators include the relative strength index (RSI), the stochastic oscillator, and the MACD.
- Volume indicators are technical indicators that use volume data to provide insight into market sentiment and the strength of a trend. Some examples of volume indicators include the on-balance volume (OBV) and the Chaikin oscillator.
(2) Choosing the right technical indicators for your swing trading strategy
- When it comes to choosing the right technical indicators for your swing trading strategy, it’s important to consider the type of assets you are trading and your personal trading style.
- For example, if you are trading a highly volatile asset, you might want to use technical indicators that are better suited to capturing short-term price movements, such as oscillators.
- On the other hand, if you are trading a more stable asset, you might want to use technical indicators that are better suited to identifying longer-term trends, such as moving averages.
(3) Interpreting technical indicators and generating trading signals
- Different technical indicators have different ways of signaling potential trading opportunities, and it’s important to understand how to read these signals correctly.
- For example, some technical indicators generate buy signals when the indicator crosses above a certain level, while others generate sell signals when the indicator crosses below a certain level.

Identifying chart patterns
(1) Types of chart patterns
- Chart patterns are specific shapes or formations that can appear on a stock chart, and they can provide insight into the likely direction of the stock’s price.
- Some common chart patterns include head and shoulders, double tops and bottoms, and triangles.
- Each of these patterns has its own unique characteristics and can provide different types of trading signals.
(2) How to identify chart patterns on a stock chart
- To identify chart patterns on a stock chart, you will need to look for specific shapes or formations that suggest a potential trend reversal or continuation.
- This can be done by visually scanning the chart for patterns, or by using technical indicators such as trend lines or moving averages to highlight potential patterns.
(3) Using chart patterns to predict price movements and make trading decisions
- Once you have identified a chart pattern on a stock chart, you can use it to make trading decisions by predicting the likely direction of the stock’s price.
- For example, if you see a head and shoulders pattern forming on a chart, it may be a signal that the stock is about to reverse its uptrend and start trending downward.
- On the other hand, if you see a double bottom pattern, it may be a signal that the stock is about to reverse its downtrend and start trending upward.
- By analyzing chart patterns and interpreting them in the context of your trading strategy, you can make informed decisions about when to enter and exit trades.

Managing your trade
(1) Adjusting your stop-loss and take-profit orders
- Stop-loss and take-profit orders are important risk management tools in swing trading.
- A stop-loss order is an order to sell a security when it reaches a certain price, in order to limit potential losses.
- A take-profit order is an order to sell a security when it reaches a certain price, in order to lock in profits.
- It is important to adjust or trail your stop-loss and take-profit orders as the trade progresses, in order to reflect changing market conditions and to manage your risk.
(2) Position sizing and risk management
- Position sizing refers to the amount of money you invest in a trade.
- Proper position sizing is essential for risk management in swing trading.
- It is important to determine the appropriate size of your position based on your risk tolerance and your trading objectives.
- This can help you to avoid over-exposing yourself to risk and to avoid taking on more risk than you can handle.
- For example, let’s say the stock is currently trading at ₹50 per share and you want to enter the trade at ₹51 per share. Your stop-loss will be placed at ₹45.90 per share (10% below your entry price of ₹51). Based on the ₹1,000 of risk you are willing to take on, you can calculate the maximum position size as follows:
Maximum position size = Risk / (Entry price – Stop-loss price)
Maximum position size = ₹1,000 / (₹51 – ₹45.90)
Maximum position size = ₹1,000 / ₹5.10
Maximum position size = 196 shares
This means that you can buy a maximum of 196 shares of the stock, based on your risk tolerance and the stop-loss level you have chosen. This will help you to manage your risk and ensure that you are not over-exposing yourself to potential losses.
(3) Exiting a trade and closing out your position
- Exiting a trade and closing out your position is an important part of swing trading.
- It is important to have a plan for how and when you will exit a trade, in order to manage your risk and to maximize your profits.
- This may involve using stop-loss and take-profit orders, or it may involve manually closing out your position at a certain point in the trade.
- It is important to be disciplined and to stick to your exit plan, in order to avoid letting emotions cloud your judgment.
Advanced swing trading techniques
(1) Combining technical and fundamental analysis
- Technical analysis and fundamental analysis are two different approaches to analyzing financial markets and making investment decisions.
- Technical analysis is based on the idea that prices follow certain patterns, and involves the use of charts and technical indicators to identify trends and trading signals.
- Fundamental analysis, on the other hand, involves looking at the underlying economic and financial factors that can impact the value of an asset.
- One way to enhance your swing trading strategy is by combining these two approaches.
- For example, you might use technical analysis to identify potential entry and exit points for a trade, and then use fundamental analysis to confirm or refute your hypothesis.
- This can give you a more well-rounded view of the market and help you make more informed trading decisions.
(2) Using multiple time frames for trade analysis
- When analyzing a financial market or asset, it can be useful to look at different time frames to get a better understanding of the overall trend.
- For example, you might look at a long-term chart to identify the overall trend, and then switch to a shorter-term chart to find entry and exit points for your trades.
- Using multiple time frames can help you see the big picture and identify long-term trends, while also allowing you to get a more detailed view of the market and identify potential trading opportunities.
(3) Identifying support and resistance levels
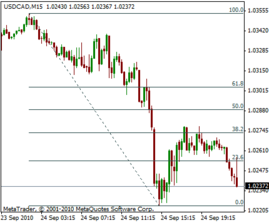
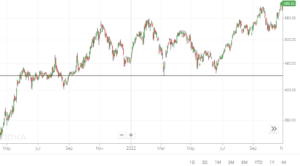
- Support and resistance levels are key levels on a stock chart where the price has a tendency to either bounce back (support) or reverse (resistance).
- These levels can be identified using technical analysis tools such as trend lines, moving averages, and previous highs and lows.
- When swing trading, it can be useful to identify key support and resistance levels as they can give you an idea of where the price is likely to go.
- For example, if the price of a stock hits a key resistance level and then starts to turn down, it could be a good time to exit your trade.
- Similarly, if the price hits a key support level and starts to rise, it could be a good time to enter a trade.
Tips to improve swing trading :
- Stay up to date with market news and analysis: Keep track of economic events and market developments that could affect your trades. This can help you to make more informed decisions about when to enter and exit trades.
- Practice with a demo account: Many online brokers offer demo accounts that allow you to practice swing trading without risking real money. This can be a great way to try out different strategies and see how they perform in different market conditions.
- Seek out additional education and resources: Look for educational materials, such as books, courses, or webinars, that can help you to deepen your understanding of swing trading and technical analysis. There are many resources available online and in person that can help you to improve your skills.
- Keep a trading journal: This can be a useful tool for tracking your trades, analyzing your performance, and identifying areas for improvement. A trading journal can help you to identify patterns and trends in your trades, and to make more informed decisions in the future.
- Manage risk carefully: Risk management is a crucial aspect of swing trading. Make sure to set stop-loss orders and take-profit orders for each trade, and consider using position sizing techniques to manage your risk.
- Stay disciplined: Trading can be emotionally challenging, and it’s easy to get caught up in the excitement of a winning trade or the disappointment of a losing trade. Stay disciplined and stick to your trading plan, even when things don’t go as expected.
- Keep learning: The markets are constantly changing, and it’s important to stay up to date with the latest trends and techniques. Make an effort to continue learning and improving your skills, and you’ll be well-positioned to succeed as a swing trader.
Reading material for increasing your understanding of swing trading :
Websites:
- Investopedia: This website offers a wide range of educational resources on topics related to trading and investing, including technical analysis.
- StockCharts.com: This website provides access to a variety of technical analysis tools, including real-time charts and technical indicators.
- TradingView: This website offers interactive charts, technical analysis tools, and a community of traders where you can share ideas and learn from others.
- Zerodha varsity : A complete guide is given on various forms of trading, different chart patterns etc in a comprehensive manner.
Books for swing trading :
- “Technical Analysis of the Financial Markets” by John J. Murphy: This book is a comprehensive guide to technical analysis, covering the key concepts and techniques used by traders.
- “Swing Trading for Dummies” by Omar Bassal: This book is a beginner’s guide to swing trading, covering the basics of how to identify and trade swing opportunities.
- “The Complete Guide to Technical Trading Tactics” by John L. Person: This book provides a detailed overview of technical trading tactics, including how to use chart patterns, indicators, and other tools to make informed trading decisions.
Other materials:
- Online courses: There are many online courses available that cover swing trading and technical analysis. These can be a great way to learn at your own pace and get personalized instruction.
- Webinars: Many trading websites and organizations offer webinars on swing trading and technical analysis. These can be a convenient way to learn from experts and ask questions in real-time.
- Trading forums: Online forums and discussion groups can be a great place to learn from other traders and get feedback on your trades. Look for forums that are focused on swing trading and technical analysis.
Summary :
Technical analysis is a method of evaluating securities by analyzing statistical trends and patterns in the data. It can be used to identify trends, identify chart patterns, and generate trading signals. By mastering the art of technical analysis, swing traders can improve their chances of success and make more informed trading decisions.

ALSO READ : Technical analysis of shares
ALSO READ : Fundamental analysis of shares


