


Ichimoku indicator
About Ichimoku
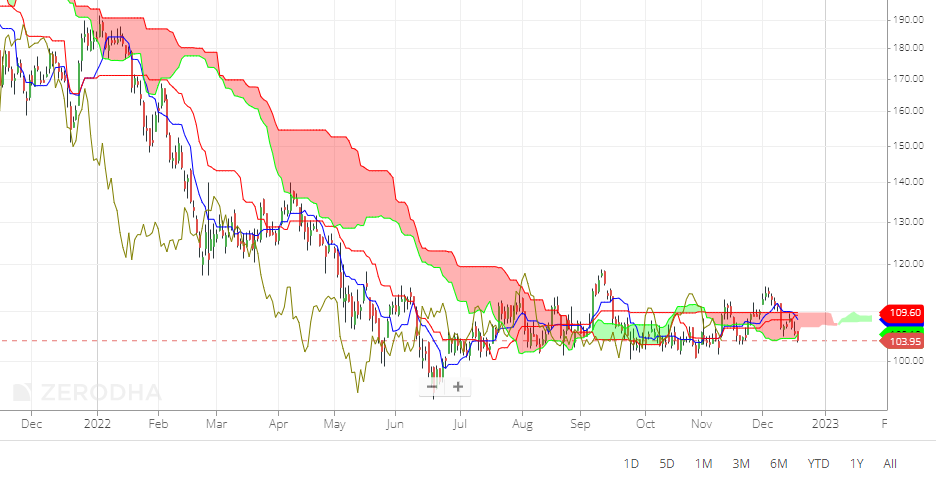
The Ichimoku Kinko Hyo, or Ichimoku Cloud, is a technical analysis indicator used to identify potential support and resistance levels and to generate buy and sell signals. It was developed in the late 1930s by Japanese journalist Goichi Hosoda, who wanted to create a tool that would allow him to quickly and easily analyze the market.
The Ichimoku Cloud consists of five lines: the Tenkan-sen, Kijun-sen, Senkou Span A, Senkou Span B, and Chikou Span. These lines are plotted on a chart and form a “cloud” that is used to identify potential trends and areas of support and resistance.
The Tenkan-sen, also known as the conversion line, is a short-term moving average that is calculated by taking the average of the highest high and the lowest low over the past nine periods.
The Kijun-sen, also known as the base line, is a longer-term moving average calculated by taking the average of the highest high and the lowest low over the past 26 periods.
The Senkou Span A, also known as the leading span A, is the midpoint between the Tenkan-sen and Kijun-sen, plotted 26 periods ahead of the current period.
The Senkou Span B, also known as the leading span B, is the midpoint between the highest high and the lowest low over the past 52 periods, plotted 26 periods ahead of the current period.
The Chikou Span, also known as the lagging span, is the current closing price plotted 26 periods behind the current period.

How to use Ichimoku indicators ?
To use the Ichimoku Cloud to generate buy and sell signals, there are a few key patterns to look for:
- If the Tenkan-sen crosses above the Kijun-sen, it is generally considered a bullish signal, indicating that the trend is shifting upward.
- If the Tenkan-sen crosses below the Kijun-sen, it is generally considered a bearish signal, indicating that the trend is shifting downward.
- If the price is above the cloud, it is generally considered bullish, as it indicates that the trend is upward and that there is strong support at the current level.
- If the price is below the cloud, it is generally considered bearish, as it indicates that the trend is downward and that there is strong resistance at the current level.
- If the Chikou Span is above the price, it is generally considered bullish, as it indicates that there is strong support at the current level.
- If the Chikou Span is below the price, it is generally considered bearish, as it indicates that there is strong resistance at the current level.

In addition to generating buy and sell signals, the Ichimoku Cloud can also be used to identify potential support and resistance levels.
- If the price is above the cloud, the cloud itself can act as a support level. If the price falls back down to the cloud, it may bounce off the cloud and continue moving upward.
- If the price is below the cloud, the cloud itself can act as a resistance level. If the price rises up to the cloud, it may bounce off the cloud and continue moving downward.
- The Senkou Span A and Senkou Span B lines can also act as potential support and resistance levels. If the price is above the cloud, the Senkou Span A and Senkou Span B lines can act as potential support levels. If the price is below the cloud, the Senkou Span A and Senkou Span B lines can act as potential resistance levels.
It’s also worth noting that the “Ichimoku Cloud works best in trending markets”, and may not be as effective in ranging or sideways markets.
Conclusion : The Ichimoku Cloud is a technical analysis indicator that can be used to identify potential trends, support and resistance levels, and generate buy and sell signals. It is just one tool among many that can be used to analyze the market, and it should not be used in isolation. It’s always a good idea to use multiple indicators and to consider other factors, such as fundamental analysis and market news, when making trading decisions.


ALSO READ : Technical analysis of shares