


Fibonacci retracement | Stochastic oscillator
Fibonacci retracement
Fibonacci retracement is a technical analysis tool that uses horizontal lines to indicate areas of support or resistance at the key Fibonacci levels before the price continues in the original direction. These levels are derived from the Fibonacci sequence and are commonly used in conjunction with trend lines to find entry and exit points in the market.
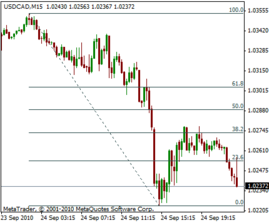
Fibonacci retracement levels are calculated by taking a high and low point on a chart and dividing the vertical distance by the key Fibonacci ratios of 23.6%, 38.2%, 50%, 61.8% and 100%. These levels can then be used to identify potential support and resistance levels and help traders make informed decisions about their trades.
Example :
Let’s say that a stock has been in an uptrend and reaches a new high. The stock then pulls back and forms a low. To calculate the Fibonacci retracement levels, we would first identify the high and low points on the chart. Let’s say the high point is at ₹100 and the low point is at ₹50. The vertical distance between the high and low points is ₹50. We can then divide this distance by the key Fibonacci ratios to find the retracement levels.
The 23.6% retracement level would be calculated as follows:
(100 – 50) x 23.6% + 50 = 61.8
The 38.2% retracement level would be calculated as follows:
(100 – 50) x 38.2% + 50 = 76.4
The 50% retracement level would be calculated as follows:
(100 – 50) x 50% + 50 = 75
The 61.8% retracement level would be calculated as follows:
(100 – 50) x 61.8% + 50 = 88.6
The 100% retracement level would be calculated as follows:
(100 – 50) x 100% + 50 = 100
These levels can then be plotted on a chart as horizontal lines. The “idea is that if the price of the stock falls to one of these levels, it may find support and bounce back up, or it may be met with resistance and fall back down”.
Traders can use these levels in a variety of ways. Some traders may use them as entry points, looking to buy the stock when it reaches a support level or sell it when it reaches a resistance level. Others may use them as exit points, closing their positions when the price reaches a Fibonacci level.
It’s important to note that Fibonacci retracement levels are not a guarantee of support or resistance and should be used in conjunction with other technical analysis tools, such as trend lines and chart patterns, to make informed trading decisions.
Here’s an example of how Fibonacci retracement levels could be used in a trade:
Let’s say that a stock has been in an uptrend and reaches a new high. The stock then pulls back and forms a low. A trader may use the Fibonacci retracement levels to identify potential entry points. If the stock falls to the 38.2% retracement level and then bounces back up, the trader may enter a long position, believing that the stock will continue to rise. If the stock falls to the 61.8% retracement level and then bounces back up, the trader may enter a long position with a tighter stop-loss, as the 61.8% level is considered a more significant support level.
On the other hand, if the stock falls to a Fibonacci retracement level and then breaks through it, the trader may consider closing their position or entering a short position, as the break below a support level may indicate that the trend is reversing.
It’s also worth noting that Fibonacci retracement levels can be used in conjunction with trend lines to find potential entry and exit points. For example, if a stock is in an uptrend and reaches a new high, a trader may draw a trend line from the low to the high and use the Fibonacci retracement levels to find potential entry points along the trend line. If the stock falls to a Fibonacci level and then bounces back up, the trader may enter a long position, believing that the stock will continue to rise along the trend line.
Fibonacci retracement levels can also be used in conjunction with chart patterns, such as head and shoulders or flags and pennants, to find potential entry and exit points. For example, if a stock is forming a head and shoulders pattern, a trader may use the Fibonacci retracement levels to identify potential entry points after the right shoulder is formed.
Conclusion : Fibonacci retracement is a technical analysis tool that uses horizontal lines to indicate areas of support and resistance at key Fibonacci levels. These levels are derived from the Fibonacci sequence and can be used in conjunction with trend lines, chart patterns, and other technical analysis tools to find potential entry and exit points in the market. It’s important to note that Fibonacci retracement levels are not a guarantee of support or resistance and should be used as part of a larger trading strategy.
Stochastic oscillator
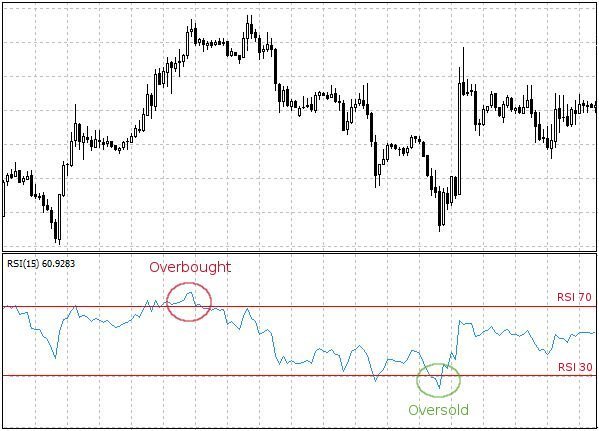
The Stochastic Oscillator is a momentum indicator that is used in technical analysis to determine overbought and oversold conditions in the market. It was developed by George Lane in the 1950s and has since become a popular tool among traders and investors.
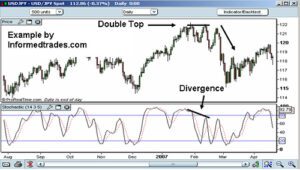
The Stochastic Oscillator is based on the idea that prices tend to close near the high when the market is bullish and near the low when the market is bearish. It uses the concept of momentum to determine the strength of the current trend and can help traders identify potential reversals in the market.
To calculate the Stochastic Oscillator, we need to first determine the highest high and the lowest low over a certain number of periods. For example, if we want to calculate the Stochastic Oscillator using a 14-day period, we would look at the highest high and the lowest low over the past 14 days.
Next, we subtract the current closing price from the lowest low and divide the result by the highest high minus the lowest low. This gives us the Stochastic Oscillator value, which is a percentage between 0 and 100.
The Stochastic Oscillator is typically plotted as a line on a chart, along with an upper and lower threshold of 80 and 20, respectively. When the Stochastic Oscillator is above 80, it is considered overbought and when it is below 20, it is considered oversold. These levels can be adjusted based on the trader’s preference and the characteristics of the market being analyzed.
Example :
Let’s say we are analyzing the stock of XYZ Company and we want to use the Stochastic Oscillator to determine if it is overbought or oversold. We decide to use a 14-day period for our calculations and plot the Stochastic Oscillator on a chart.
On the first day of our analysis, the highest high over the past 14 days is ₹100 and the lowest low is ₹50. The current closing price is $80, which means the Stochastic Oscillator value is (80-50)/(100-50) = 30%.
On the second day, the highest high remains at $100, but the lowest low drops to $40 and the current closing price is ₹70. This means the Stochastic Oscillator value is (70-40)/(100-40) = 50%.
As we continue to plot the Stochastic Oscillator values on our chart, we notice that it consistently stays above 80 for several days. This indicates that the stock is overbought and we may want to consider taking profits or selling our position.
However, we also see that the stock has been consistently breaking through resistance levels, indicating strong bullish momentum. In this case, we may decide to hold onto our position and wait for a potential reversal before selling.
As the Stochastic Oscillator continues to fluctuate, we also notice that it dips below 20 for a few days. This indicates that the stock is oversold and we may want to consider buying in or adding to our position.
However, it’s important to note that the Stochastic Oscillator should not be used in isolation and should be combined with other technical indicators and fundamental analysis to make informed trading decisions. It’s also worth noting that the Stochastic Oscillator can produce false signals, especially in choppy markets, so it’s important to be cautious and use it as just one part of your overall trading strategy.
Conclusion : The Stochastic Oscillator is a valuable tool for traders and investors looking to identify overbought and oversold conditions in the market. By using this indicator in combination with other technical indicators and fundamental analysis, traders can potentially maximize profits and manage risk. However, it’s important to be aware of the limitations of the Stochastic Oscillator and use it as just one part of a comprehensive trading strategy.
ALSO READ : Technical analysis of shares
ALSO READ : RSI, Bollinger bands and MACD
ALSO READ : Moving averages in technical analysis