Benefits of RSI | Drawbacks of RSI
The relative strength index (RSI) is a technical indicator used in the analysis of financial markets. It is a momentum oscillator that measures the speed and change of price movements. The RSI is calculated using the average gain and loss of an asset over a given time period.
Benefits of using the relative strength index (RSI):
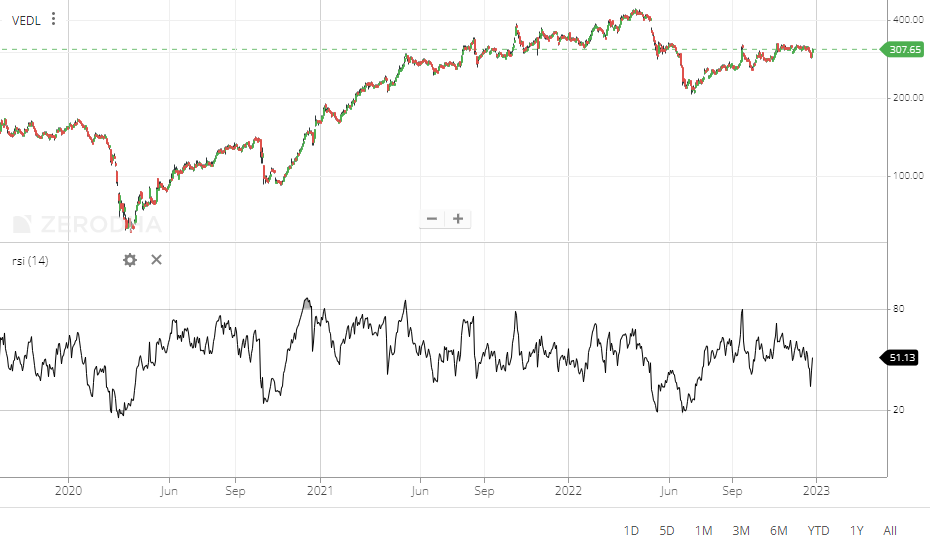
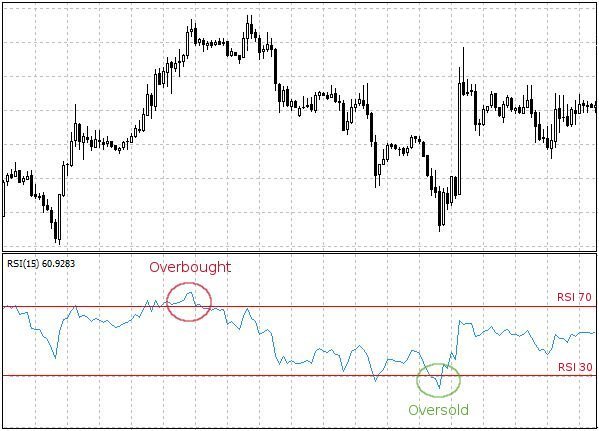
- It can help identify overbought and oversold conditions in the market. When the RSI is above 70, it may indicate that the asset is overbought and may be due for a price correction. Conversely, when the RSI is below 30, it may indicate that the asset is oversold and may be a good time to buy.
- It can be used to confirm trend reversals. When the RSI diverges from the price action of the asset, it may indicate a potential reversal in the trend.
- It can be used to identify potential buying and selling opportunities. When the RSI is above 70 and then falls below it, it may be a good time to sell. Conversely, when the RSI is below 30 and then rises above it, it may be a good time to buy.
- It can be used to identify possible trend continuations. When the RSI is in an uptrend and makes higher highs, it may indicate that the uptrend is likely to continue. Similarly, when the RSI is in a downtrend and makes lower lows, it may indicate that the downtrend is likely to continue.
- It can be used to identify potential trend changes. When the RSI makes a lower high while the price is making a higher high, it may indicate a potential trend change.
- It can be used to identify divergences between the RSI and price. When the RSI and price are moving in opposite directions, it may indicate a potential trend reversal.
- It is a widely used and well-known indicator, so it can provide additional confirmation for traders and investors.
Drawbacks of using the relative strength index (RSI):

- It is a lagging indicator. The RSI is based on past price action, so it may not always provide timely signals.
- It can produce false signals. The RSI is sensitive to price movements, so it may generate false signals in choppy or ranging markets.
- It does not take into account the fundamental factors that drive price movements. The RSI is purely a technical indicator, so it does not consider factors such as economic news, earnings reports, or changes in interest rates.
- It can be affected by volatility. In a highly volatile market, the RSI can produce exaggerated readings that may not accurately reflect the true strength of the asset.
- It can be affected by the time period used in the calculation. A longer time period may smooth out the RSI and reduce the number of false signals, but it may also produce fewer signals overall. A shorter time period may produce more signals, but it may also increase the number of false signals.
- It may not be as effective in sideways or ranging markets. In these types of markets, the RSI may oscillate around the 50 level and produce fewer meaningful signals.
- It is a subjective indicator, as the overbought and oversold levels are based on the interpretation of the trader or investor.
- It can be affected by gaps in the price data, as the RSI is based on the closing prices of an asset. If there are gaps in the price data, the RSI may not accurately reflect the true strength of the asset.
Conclusion : The RSI can be a useful tool for traders and investors, but it should be used in conjunction with other technical and fundamental analysis techniques.


Benefits of RSI | Drawbacks of RSI
Also read : RSI, Bollinger bands and MACD
Also read : Technical analysis of shares


